
Stay connected with BizTech Community—follow us on Instagram and Facebook for the latest news and reviews delivered straight to you.
The market atmosphere is changing rapidly after a much-needed breath of fresh air that drove Bitcoin over $76,000 for the first time since early February. Retail sentiment usually follows price activity, but on-chain data shows a far more cautious view of the near future.
A new intelligence analysis from CryptoQuant says that the world’s top digital asset is facing a wall of short-term selling pressure that is becoming worse. The recent bullish momentum may be running out of steam because of a rapid rise in profit-taking and a huge surge of capital moving back to controlled exchanges.
Here is a closer look at the on-chain signals, the state of the economy as a whole, and why big crypto investors might be getting ready for a big market correction.
The Parts of the Rally and the $76,800 Blockage
To have a better idea of the present selling pressure, we need to look at what caused the recent gain in the first place. Julio Moreno, the Head of Research at CryptoQuant, said that a number of things coming together caused Bitcoin’s price to rise. The asset had dropped into a technically undervalued area, making it a good time for shelved capital to get in. At the same time, a brief easing of tensions between the US and Iran helped people feel more willing to take risks in general.
A weakening U.S. Dollar was a big part of why this happened. Anyone who has looked at the historical relationship between global monetary indicators and digital assets knows that a weaker U.S. Dollar Index (DXY) always eases pressure on risk-on markets, giving assets like Bitcoin leeway to grow.
But after hitting $76,000, that momentum suddenly stopped, and the price fell back to the $74,800 level.
Bitcoin is now up against a major psychological and technical barrier: the “realized price” for short-term traders, which is about $76,800. In on-chain analytics, the realized price is the average cost basis of those who have bought recently. In the past, this level has been a strong resistance zone during bearish or transitional market times. As the price gets closer to this break-even point, traders who have been losing money for weeks tend to sell just to get their initial investment back.
CryptoQuant says that if Bitcoin can’t break above this $76,800 resistance, the market might start to look like it did in early 2026, when surprise gains were violently rejected. If the selling pressure gets worse, analysts say that $67,600 is the most important and immediate support floor. For a broader look at what analysts are projecting, see Four Crypto Experts Reveal Latest Bitcoin Price Trend Forecasts.
Exchange Inflows Go Up a Lot
The report’s most worrying number is perhaps the huge amount of Bitcoin that is now migrating from cold storage to centralized trading platforms.
In the area of blockchain forensics, exchange inflows are a classic sign of intent. Investors keep their assets in cold wallets for a long time. When they’re ready to sell, trade, or use them as collateral, they shift them to exchanges.
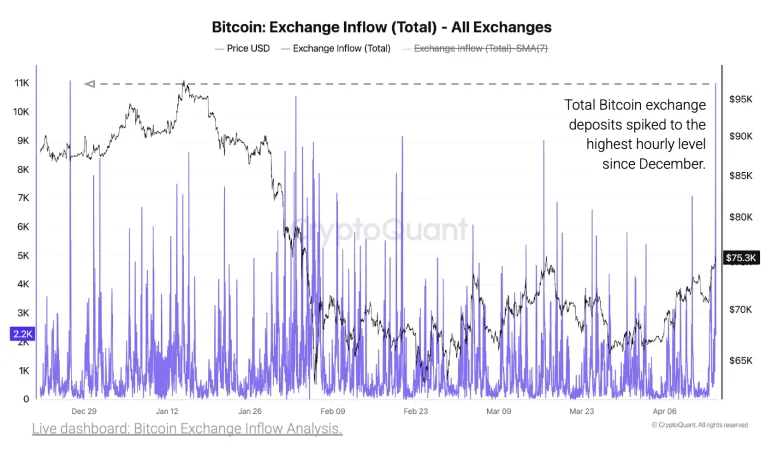
Recent CryptoQuant data shows that hourly Bitcoin inflows have skyrocketed to an unbelievable 11,000 BTC. To put it in context, the network hasn’t seen this many hourly exchange deposits since December 2025.
This one number is enough to make you cautious. Last month, something similar happened. In March 2026, the amount of BTC coming onto exchanges quickly rose to 9,000 per hour. What happened next was a quick, steep drop in prices when the new supply was put on the open market. This pattern mirrors what was observed during the BTC crash in February 2025, raising questions about whether history is repeating itself.
The Return of Big Deposits
The inflow data shows that retail investors are not the ones influencing the market right now; the whales have woken up.
The average size of a Bitcoin deposit sent to an exchange has just risen to 2.25 BTC. This is the biggest average deposit amount since July 2024. Blockchain monitors have even found a few huge, isolated transactions going straight to Binance, with each transfer being worth more than 1,000 BTC.
This concentration of big movements is throwing off the network’s volume dynamics in a big way. In a relatively short amount of time, the percentage of “large deposits” compared to overall exchange inflows has gone from less than 10% to an incredible 40%.
In the past, if massive whale deposits made up more than 40% of overall inflows, there was nearly always a lot of short-term selling pressure after that. The way things are now is eerily similar to January 2026, when a lot of big whale deposits came in and led to a severe market collapse that brought Bitcoin down from its $100,000 highs to the $60,000 region. For context on how whale movements have historically signaled market turns, the pattern is well documented. You can also explore how Arkham tracks these large crypto wallet movements in real time.
The Profit-Taking Problem
CryptoQuant experts point out an interesting paradox: even if a lot of coins are coming into exchanges, actual profit-taking has not yet hit its mathematical high.
Right now, daily profits are around $500 million. This number is big, but it’s still well below the $1 billion line that usually means a huge wave of profit-taking that stops the market amid negative conditions.
This makes things quite dangerous for the next few days. Moreno said that if Bitcoin stays over $76,000 and starts to move toward the important $76,800 resistance level, it will make thousands of wallets profitable. This could be a tripwire. A surge higher could ironically be just what it takes to get daily realized gains over the $1 billion threshold. This would start a flood of selling pressure that had been dormant and could stop the rise in its tracks and cause a severe reversal. A similar dynamic unfolded when whale profit-taking triggered a sharp market correction at higher price levels.
The overall trend in the economy may still be going up, but the Bitcoin network’s internal plumbing is showing blazing amber. The data makes it clear that traders who are trying to make sense of the current situation should not simply think about the possibility of a short-term correction; it is a very likely scenario that is currently being written on the blockchain. To stay ahead of developments, keep an eye on key US economic reports that could influence the crypto market in the days ahead.
Read Also: US Bitcoin ETFs Record $471 Million Inflow, Largest Single-Day Gain Since Late February