Stay connected with BizTech Community—follow us on Instagram and Facebook for the latest news and reviews delivered straight to you.
In the last several weeks, Bitcoin’s on-chain activity has noticeably slowed down. The number of transactions and short-term traders has dropped a lot. But below this slowdown is a strong counter-trend: long-term holders and high-conviction investors are still buying BTC at an ever-increasing rate. The difference shows a classic late-cycle pattern: speculative froth goes down as patient capital quietly builds up its position.
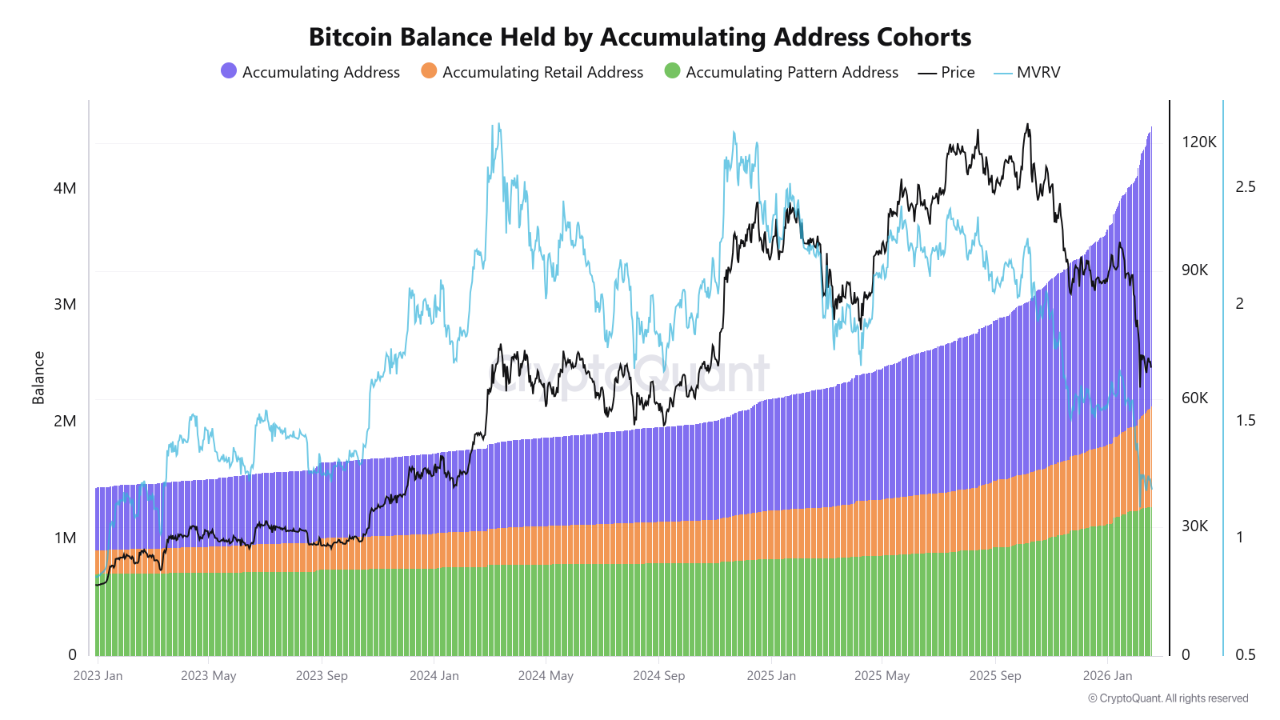
In a long update on February 20, 2026, CryptoQuant analyst CryptoZeno pointed out this divide. He added, “Bitcoin’s market structure is clearly changing.” “Long-term conviction is getting stronger, while short-term speculative rotation is slowing down.” Accumulating addresses, or wallets that have been getting more money over time, have continually increased their holdings even as total network traffic has gone down. This pattern includes both small retail addresses and larger institutional or whale-class wallets, showing that people have a lot of faith in Bitcoin’s long-term value.
The data matches what has happened in the past. In the past, during consolidation phases—especially when there were pauses in the middle of the cycle following big rallies—short-term activity would typically slow down as long-term holders quietly took up the available supply. When shorter-term traders stop selling, it tends to tighten floating liquidity, which sets the stage for further swings up after sentiment settles down.
Short-term activity goes down on a number of fronts
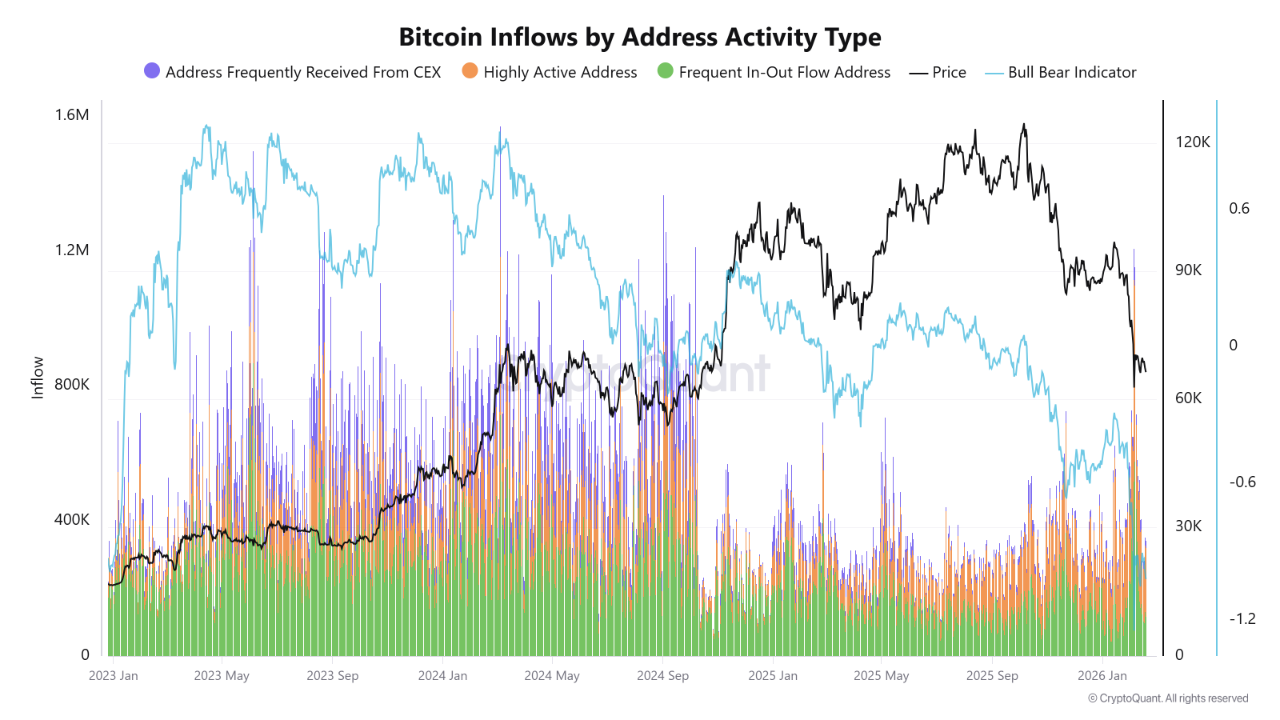
CryptoZeno highlighted to a number of signs that shorter-term holders are not doing well. Compared to past periods of growth, inflows from addresses connected to centralized exchanges have slowed down.
Wallets that show a lot of deposits and withdrawals at the same time, which is usually a sign of busy trading and providing liquidity, have also seen a big drop in activity.
The Short-Term Holder SOPR (Spent Output Profit Ratio), which shows whether recent purchases are selling at a profit or loss, has dropped into a state of acute panic. In July 2022, when Bitcoin was trading near $20,000 and retail capitulation marked the cycle bottom, this metric was last at similar levels.
Current measurements show that a lot of short-term traders have already sold their holdings at a loss, which has taken away a big source of overhead supply.
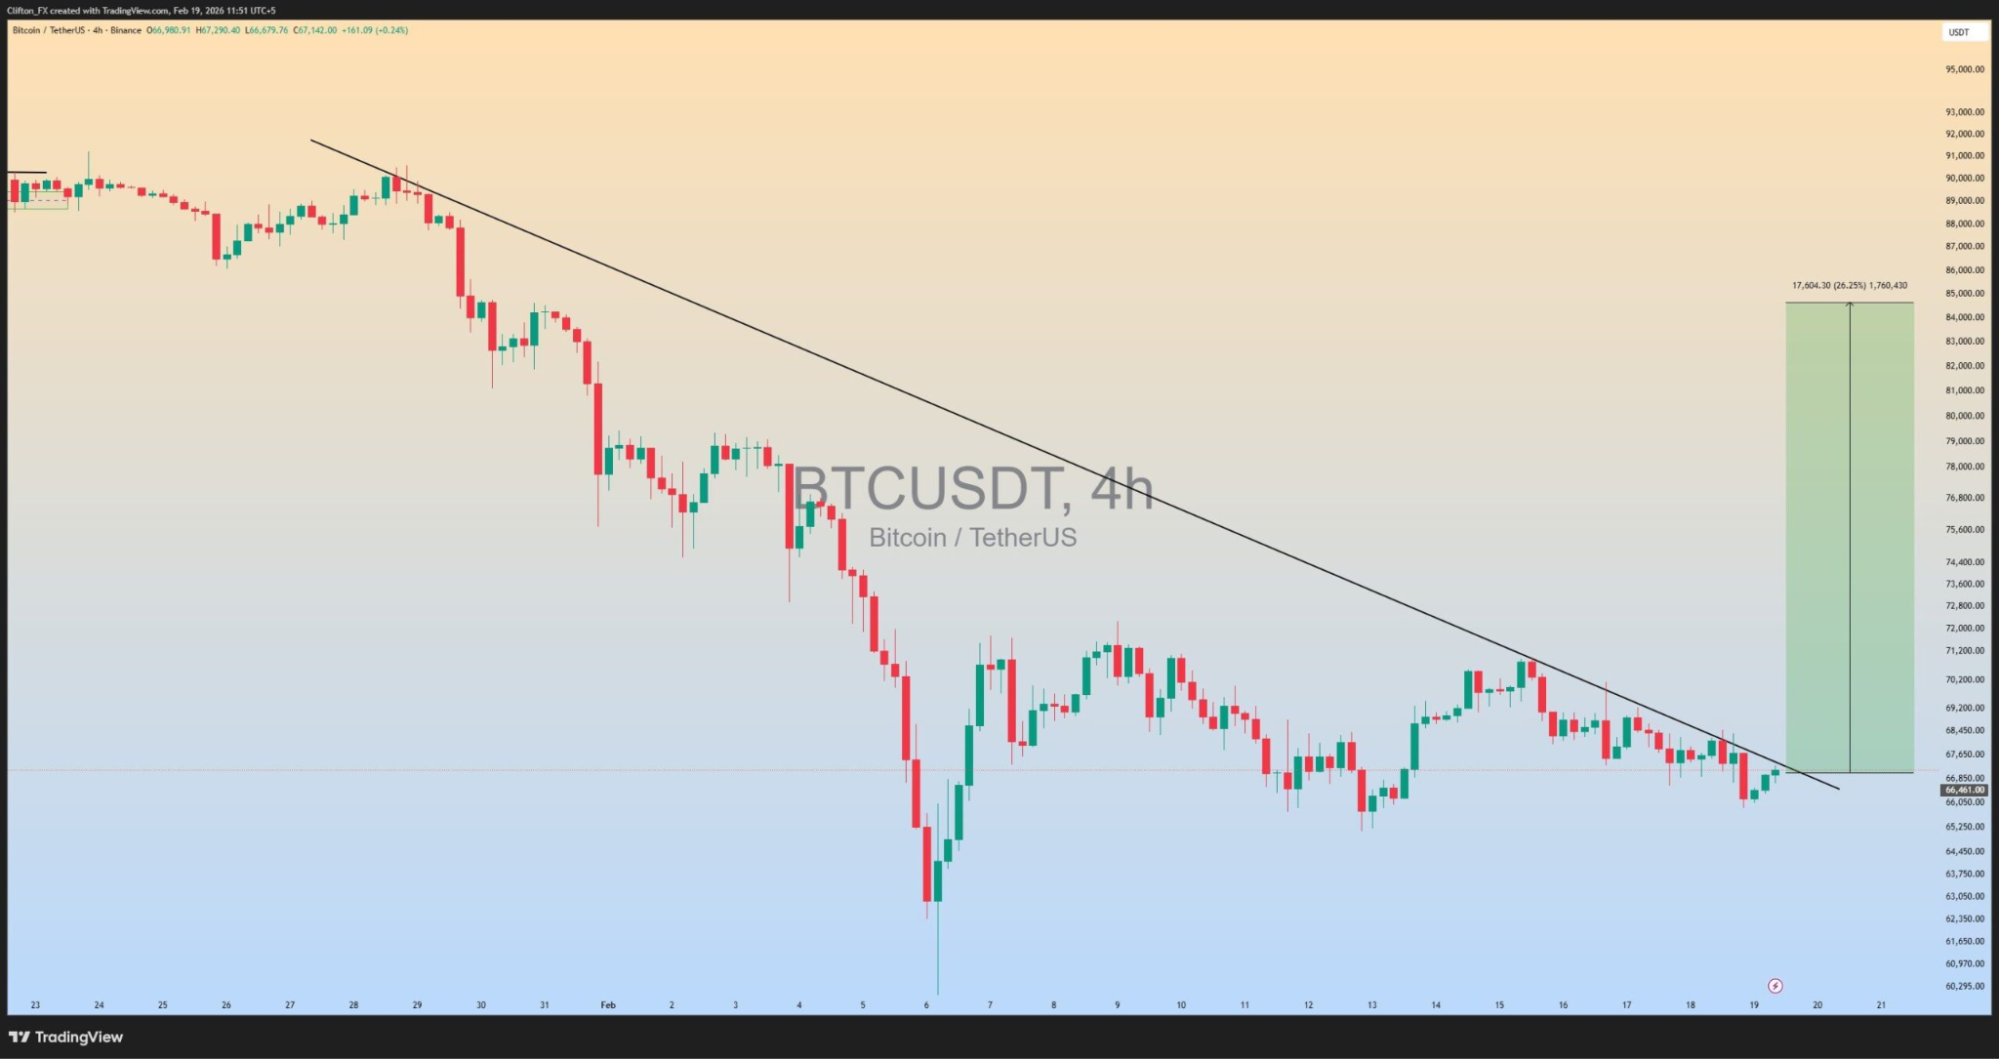
Another CryptoQuant expert, Clifton, said that Bitcoin is now testing a crucial trendline that lasts for four hours. If this level breaks out decisively, the $85,000 area could be the next target in the near future. But the market is still in a fragile consolidation phase until that confirmation comes in.
Why this difference is important
The fact that short-term activity is slowing down and long-term accumulation is speeding up has crucial effects:
- Less pressure from sellers: There are fewer short-term holders, thus there is less immediate overhead supply hitting the market during drops.
- Less liquidity: As coins go to long-term storage, the amount of coins available for trading goes down, making subsequent demand waves even stronger.- A greater basis of conviction—money that builds up during times of uncertainty tends to have stronger hands, which means they are less inclined to sell when prices drop somewhat.
- The classic rebalancing dynamic: weak hands leave and strong hands grow. This internal redistribution usually happens before big shifts in trends.
CryptoZeno said that the current situation is more like “mid-cycle consolidation” than full capitulation. He wrote, “Supply keeps being used up, but short-term rotation slows down.” “Historically, this is what happens in places where liquidity tightens and sets up bigger moves in the future.”
In a larger market context
The way Bitcoin’s price is moving right now fits into a bigger picture. The cryptocurrency has dropped more than 44% from its high of over $126,000 in October 2025. In early February 2026, it was trading between $60,000 and $71,000. The drop has happened at the same time as lower expectations for aggressive Federal Reserve rate cuts, heightened geopolitical concern, and profit-taking following a big gain in 2025.
Even though there was a dip, structural demand is still strong. Spot Bitcoin ETF inflows have maintained net positive, corporate treasuries have kept building up instead of giving up, and long-term holding indicators reveal that very few people are giving up. For weeks, the Crypto Fear & Greed Index has been in the “extreme fear” range, with readings in the low 20s—levels that have traditionally come before big changes.
This strength is backed up by on-chain data. Exchange balances keep going down, which means that long-term holders aren’t selling a lot. The realized price support, which is the total cost base of all coins, is around $55,000 and hasn’t been tested in a meaningful way yet. CryptoQuant analysts have said again and over that this area could be the “ultimate bear market bottom” for Bitcoin in this cycle.
Historical Parallels and Cycle Positioning
The current difference between short-term weakness and long-term strength is similar to what has happened in the past:
- After the bear market low in 2018, short-term activity fell off in the middle of 2019, but long-term investors quietly built up their positions. This set up the bull run from 2020 to 2021.
- In the middle of 2021, during a mid-cycle correction, speculative froth went away and conviction holders took in supplies. This happened before the peak at the end of 2021.
- After the FTX crash in the middle of 2023, retail investors gave out, which wiped out weak hands, while institutions quietly built up their holdings, which led to the rally in 2024–2025.
In each case, the same thing happened: short-term investors left, liquidity got tighter, and strong hands gained more control over supply. This cycle seems to be following the same pattern, but with more institutions involved and more regulated on-ramps.
What Could Make Things Change?
If one or more important factors change the direction of the market, Bitcoin’s present consolidation phase could turn into a real comeback. Macroeconomic clarity is the most likely thing that could drive the market.
Any clear signal from the Federal Reserve, such as forward guidance confirming continued rate cuts, a pause in balance-sheet runoff, or even dovish comments from new leadership, would probably make people feel better about taking risks in both stocks and cryptocurrencies.
At the same time, stabilizing the situation between countries could be very important. For example, if the U.S. and China were to stop threatening each other with tariffs or if there were to be less fighting in other areas of conflict, this would lower overall risk aversion and encourage capital to flow back into higher-beta assets like Bitcoin.
A decisive breach above the $85,000–$100,000 resistance zone with rising volume would be a strong technical confirmation signal. This kind of rise would almost probably cause short covering, bring in shelved buyers, and break the current bearish structure, making it easier to reach higher goals. Long-term institutional flows would give the market more structural support.
For example, if spot Bitcoin ETFs kept getting more money and corporate treasuries kept buying more, there would be a reliable bid under the market. This would protect against downward pressure and boost confidence during any further pullbacks.
Risks of going down are still high until one or more of these events happen. The $58,000–$69,000 zone is now the most important support area. This is because there have been strong clusters of demand in the past, a lot of transactions in the past, and the level is close to the 200-week moving average, which has been a reliable floor during major corrections in the past.
If this area breaks below a certain point, it would open the door to deeper targets, possibly testing the $38,000 area in more extreme bear-case scenarios. The market is still in a fragile waiting pattern for now. The balance of power is still on the side of patience and careful risk management until a definite bullish trigger appears.
Conclusion
The way the Bitcoin market is set up right now shows a classic late-cycle pattern: short-term speculation is slowing down while long-term conviction is growing through steady accumulation. Transaction volume has slowed down, short-term holder SOPR has dropped into a state of acute dread, and exchange inflows have slowed down as well. However, accumulating addresses are still taking in supplies at an ever-increasing rate.
Read Also: The First Fed Chair Who Supports Bitcoin? Who is Kevin Warsh?
This difference shows that things are getting back in balance within rather than everyone giving up. Less selling pressure from short-term investors makes floating liquidity tighter. This sets the scene for bigger swings up once mood settles down. Historical analogies show that these kinds of stages generally happen before big changes in trends, although the date is still unknown.
The most important thing for traders and investors to remember is to be patient. The market seems to be in a digesting phase, which means it’s not entirely giving up or feeling great. The next step will depend on macro drivers, technical confirmation, and institutional flows. Until then, disciplined risk management and selective acquisition during weakness are still the best ways to deal with a situation where powerful hands are slowly taking control of supply.