Stay connected with BizTech Community—follow us on Instagram and Facebook for the latest news and reviews delivered straight to you.
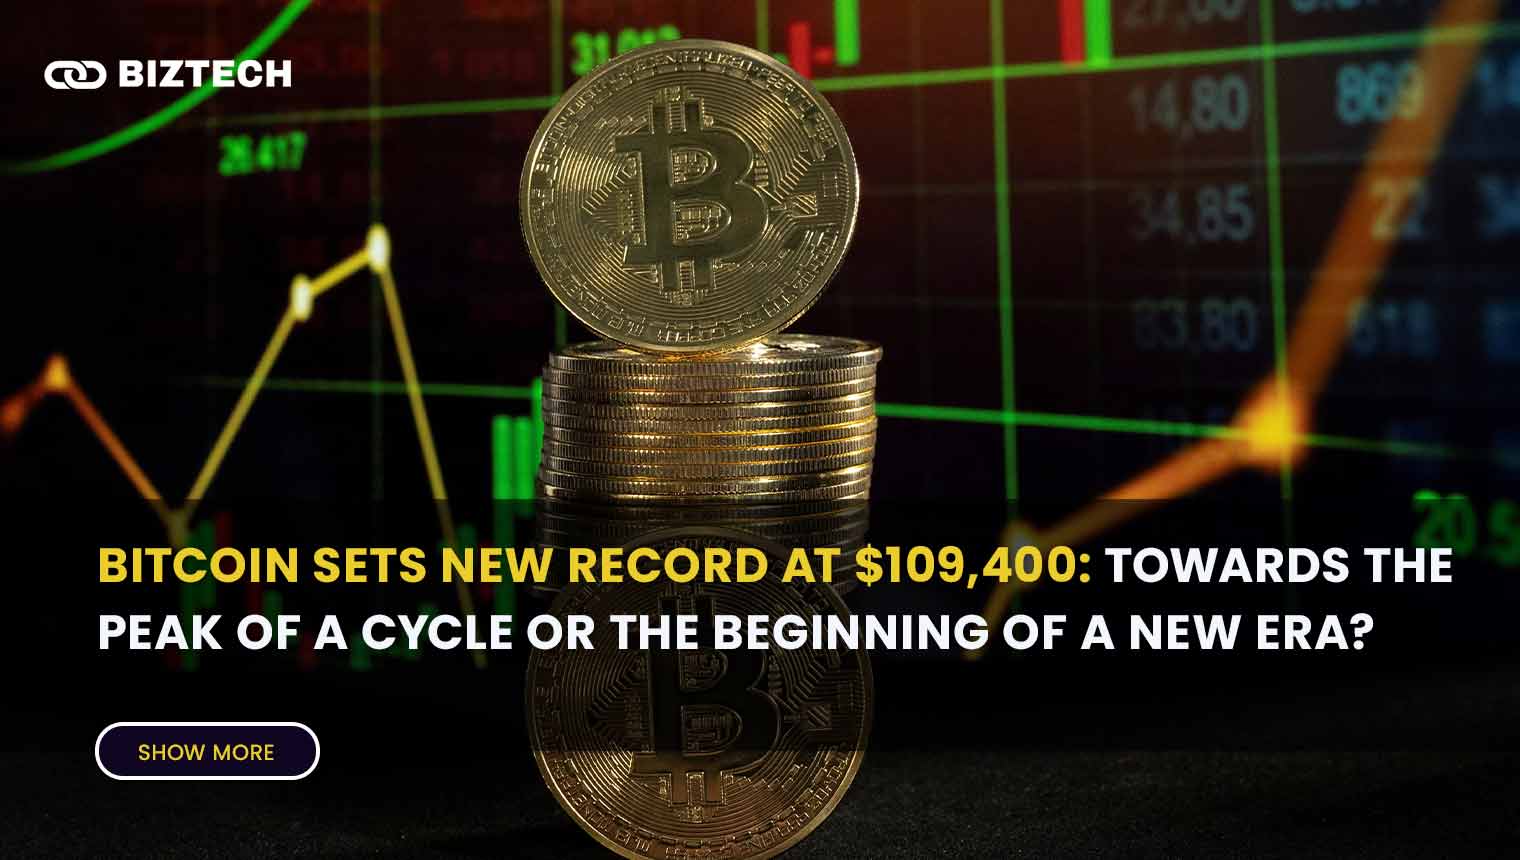
Following a sequence of worldwide events that raised investor trust in cryptocurrencies as a high-risk but highly prospective investment instrument, Bitcoin (BTC) has made history once more by attaining an all-time high of $110,400.
But this price increase begs a crucial question: Is it the doorway to a new development phase or the indication of the last part of the bull market cycle?
This rise took place just nine days after the temporary trade truce between the US and China was announced, reducing import taxes and addressing world macroeconomic issues.
The peace negotiations between Russia and Ukraine and the expansion of the world money supply, which motivates investors to search a hedge against fiat inflation, also support this momentum.
Read more about 7 possible factors that could drive the Bitcoin price to a new high in 2025.
Global Dynamics Turn into a Trigger for the Development
Cutting import taxes from the previous 25%, the White House revealed a 90-day trade agreement with China on May 12, 2025.
This action instantly reduced the possibility of an abrupt escalation in trade tensions and set investors’ risk appetite—including in the crypto market—on blast.
“The easing of geopolic tensions sends a positive signal to the market, encouraging a rotation of capital from safe-haven assets to high-risk assets like Bitcoin,” said Nansen’s research analyst Aurelie Barthere.
She claims that this action psychologically releases investors from the anxiety of uncertainty that had earlier driven Bitcoin prices down to $74,434 in early April.
Declaring that Russia and Ukraine would begin peace talks, US President Donald Trump also contributed to the hope. “We will not only discuss a ceasefire, but also the END of the war,” Trump penned on platform X.
Bitcoin Turns into a Confidence-Based Risk Tool
Head of derivatives at Bitfinex Jag Kooner claims that the market is now in a rare phase: improved geopolitical conditions, progressively friendly laws, and constantly high global liquidity.
“We are seeing a rotation of capital into BTC and high beta tech stocks instead of a capital flight from Bitcoin as usual when risk decreases,” he remarked.
This rotation marks a change in story: during macro stability, Bitcoin is now a high-conviction risk asset rather than only a store of value asset.
Indicators Indicate Possible Cycle Peak
Although the general attitude is quite positive, various technical and on-chain signals point to the market reaching its high. Professional traders typically utilize these five main markers to identify the height of the Bitcoin cycle:
1. MVRV-Z Value

BTC: Pi Cycle Top + MVRV Z-score. Source: Marie Poteriaieva, Glassnode
This indicator adjusted for volatility shows the market value of Bitcoin against its realized value. A extremely high Z-score suggests that BTC is far more expensive than the average cost of ownership, so indicating an overpriced market. The MVRV-Z Score is almost at historical peak right now.
2. Pi Cycle’s top indicator

With two moving averages—111 days and two times 350 days. The 111-SMA line becomes a classic indication indicating the price is almost at its top when it crosses the 350-SMAx2 line from below. At the highs of past bull runs—2013, 2017, and 2021 among other years—this trend has shown itself multiple times.
3. Divergence and volume OBV, or on-balance volume

Source: Tradingview
Often a symptom of declining momentum are price rises not commensurate with a rise in volume. Though prices are still rising, trade volume has actually started to flatten in line with current trend, resulting in a typical bearish divergence.
4. Puell Multiples

Source: Coinglass
This statistic compares daily miner salary to the average annual income. A high value suggests that miners typically grab gains, usually before a significant price adjustment. Right now, the Puell Multiple falls under the warning zone.
5. Exchange Inflows

Source: Marie Poteriaieva, Glassnode
BTC total transfer volume to exchanges + Puell Multiple.
A significant flood to the exchange suggests investor readiness for sale. Glassnode data shows that there was a 12% rise in Bitcoin transfer volume to exchanges last week—a sign of great spread.
Whale Behaviours and Exit Plans
Data from Glassnode shows that since the end of 2024, the number of wallets containing more over 100 BTC has risen by about 14%, to reach 18,200 addresses—the highest level since 2017. This suggests considerable whale accumulation, generally in line with the late portion of a bull market.
Fifteen percent strategy: psychological direction derived from past trends
Cole Garner, a market analyst, proposes the “15% rule,” a sensible strategy. He says the best-selling zone is 15% below the highest price when the price of Bitcoin rises vertically and then has a severe decline, breaking its parabolic pattern. Usually, this turns into the distribution hub for big institutions
Though numerous signs point to a possible downturn, some analysts remain hopeful that the bull run is not yet ended. Driven by the expansion of world money supply and the devaluation of fiat purchasing value, Jamie Coutts, an analyst at Real Vision, forecasts that Bitcoin might reach $132,000 before the end of 2025.
Global M2 expansion and BTC price have a correlation graph whereby, when liquidity floods the financial system, Bitcoin often becomes the main investment destination as a hedge against inflation.
Using a basic analogy, a plane ready to land or a rocket without brakes?
Consider Bitcoin as a rocket headed toward space propelled by geopolitical and financial pressures.
The question is: will this rocket soar to the next orbit (price exceeding $130,000) or will it start preparing for a clean landing before the next cycle starts as this fuel starts to stabilize—in the form of peace, regulation, and liquidity?
The new high for Bitcoin at $110K was molded by complicated macro dynamics, significant investor accumulation, and technical indications that have already started to issue warnings, not by itself.
While mid-term goals like $114,000 to $132,000 are still reachable, investors must become more alert against possible big drops.
Not one signal exists that precisely forecasts peaks. However, ignoring multiple indicators that light up simultaneously is like refusing to read navigation instruments in the thick of a hurricane.