Stay connected with BizTech Community—follow us on Instagram and Facebook for the latest news and reviews delivered straight to you.
Money is the driving force of the world, a fact that we have known for a long time. However, behind the movement of the modern financial market, there is one indicator that is often overlooked but has a significant influence: M2 money supply.
This indicator reflects the amount of money circulating in an economy—from the cash we hold to easily accessible bank account deposits. In the crypto world, especially Bitcoin, M2 turns out to have an important role in forecasting potential price surges.
What is M2 Money Supply?
M2 is a broad measure of liquidity in an economy. Unlike M1, which only includes cash and deposits that can be withdrawn immediately, M2 also involves slightly less liquid assets such as savings, small time deposits, and money market funds.
This is a reflection of money that is ready to be used for shopping or investment. When M2 grows, it means that more funds are flowing into the system, often driving interest in risky assets such as stocks, property, and yes—crypto.
Conversely, when M2 shrinks, liquidity decreases, and the market tends to become more conservative. Investors begin to withdraw from risky assets, including Bitcoin, towards safer options such as bonds or gold.
Historical Correlation between M2 and Bitcoin
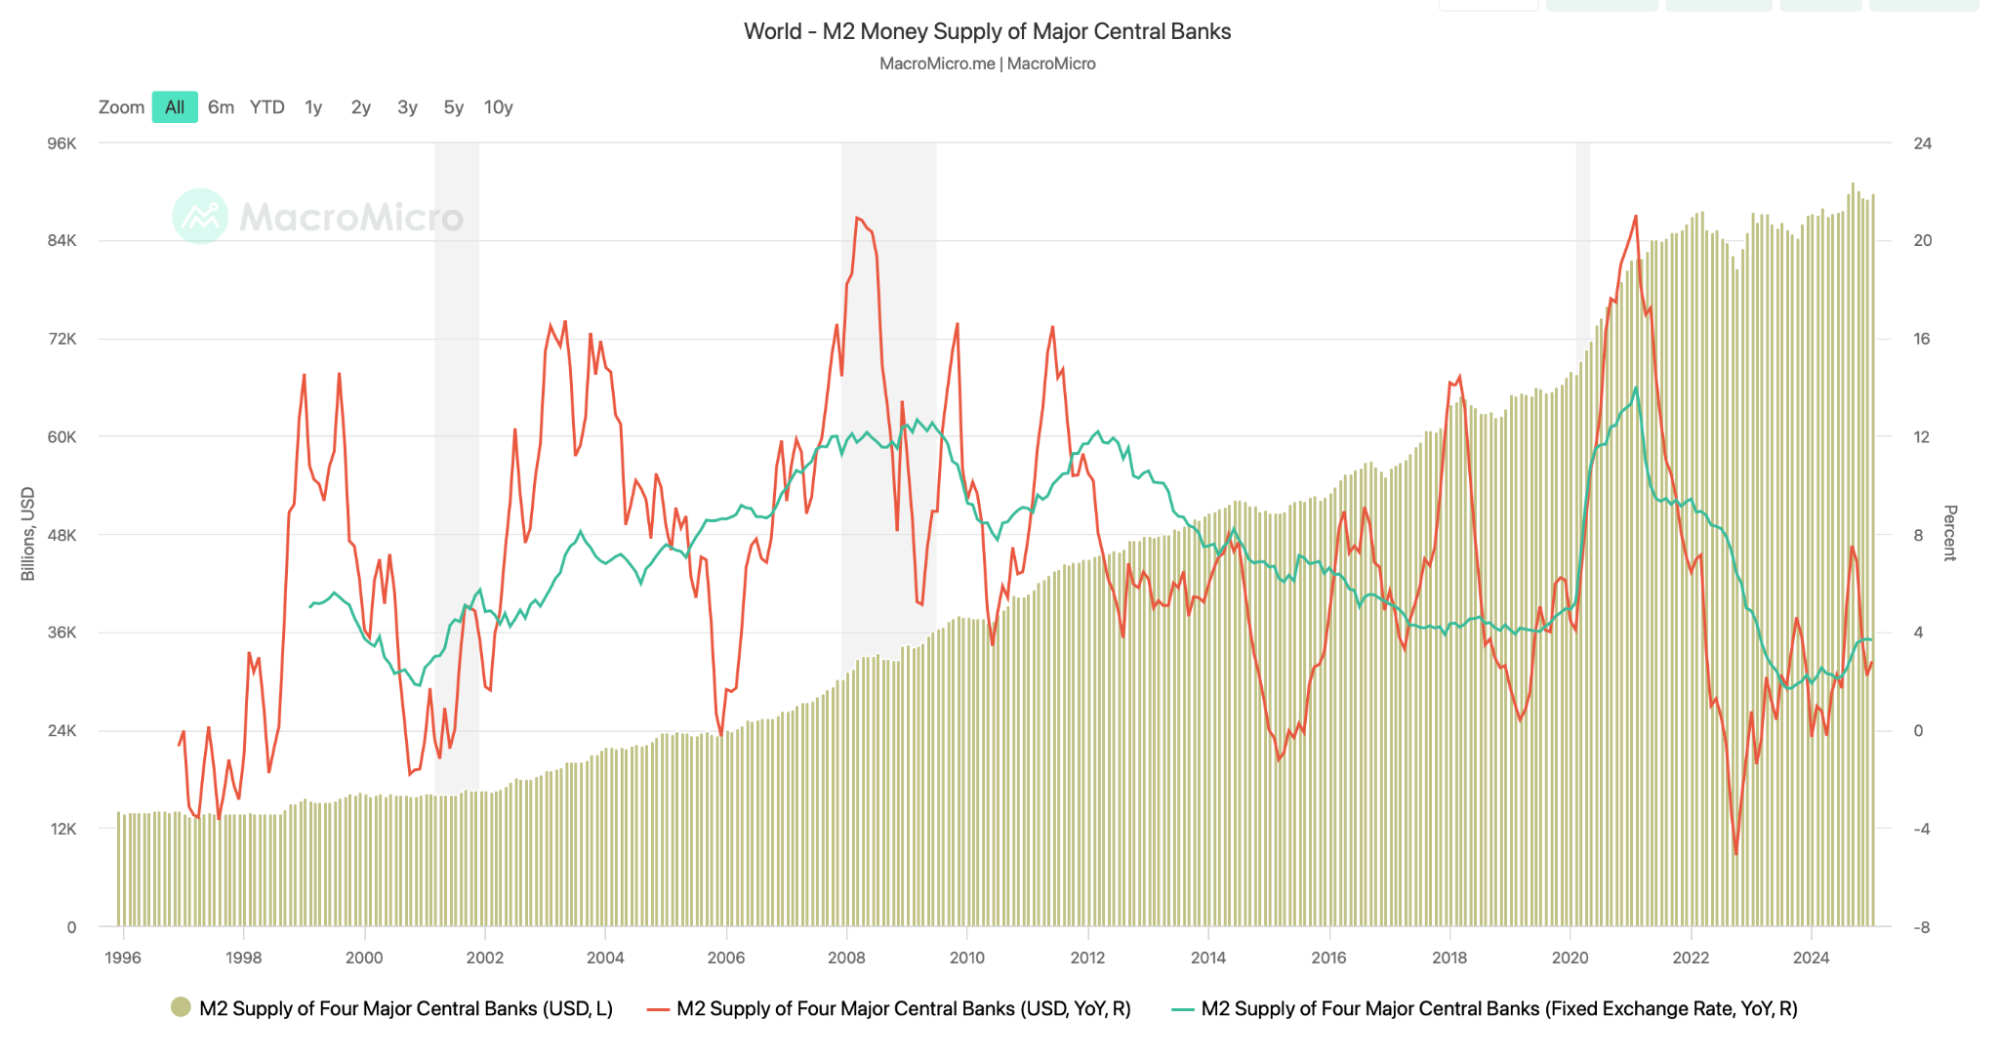
The relationship between M2 and Bitcoin’s price is nothing new. Historical data shows an interesting pattern: when global liquidity increases, Bitcoin often experiences a significant increase in price. One of the classic examples is the period after the 2008 financial crisis.
Central banks around the world, including the US Federal Reserve, launched quantitative easing (QE) policies, which pumped trillions of dollars into the economy. M2 surged, and although Bitcoin was just born at the time, the foundation for its popularity was beginning to take shape.
An even clearer surge was seen during the COVID-19 pandemic. In 2020-2021, massive economic stimulus from various countries pushed global M2 to unprecedented levels. The result? Bitcoin peaked at nearly $69,000 in November 2021. According to Forbes analysis published in February 2025, global M2 from 21 major central banks rose from $102 trillion to $107 trillion in the first two months of this year—an increase of 3.8%. During this period, Bitcoin’s market capitalization also surged, approaching $2 trillion.
A well-known analyst at X, @ColinTCrypto, in his tweet on March 4, 2025, mentioned that global M2 movements often precede increases in the prices of Bitcoin and the S&P 500 with a lag of around 72 days.
He predicts that the next surge in liquidity could begin around the end of March 2025. This prediction is supported by the historical patterns he has observed, although he emphasizes that this is not a guarantee, but rather an observation that is worth monitoring.
Why is M2 so influential?
There is a simple logic behind this: more money means more opportunities to invest. When central banks lower interest rates or buy government bonds to increase M2, investors tend to look for higher returns outside traditional assets.
Bitcoin, with its decentralized nature and limited supply (maximum of 21 million coins), is an attractive candidate as a hedge against inflation and devaluation of fiat currencies.
Conversely, when liquidity shrinks—like what happened in Japan during the “lost decade” (1991-2001)—people prefer to hoard money rather than invest it. The economy stagnates, the stock market weakens, and risky assets such as crypto lose their appeal. Fortunately, the current global trend is pointing in the opposite direction.
Current Data: What Happens in 2025?
In March 2025, global M2 continued to show signs of expansion. In addition to the 3.8% increase reported by Forbes, there has been an additional $1.5 trillion in liquidity in the last week of February from the Chinese and German central banks.
This indicates that loose monetary policy is still in place in several major economies. In the US, the $4 trillion increase in the debt ceiling on February 25, 2025, also contributed to expectations of greater liquidity.
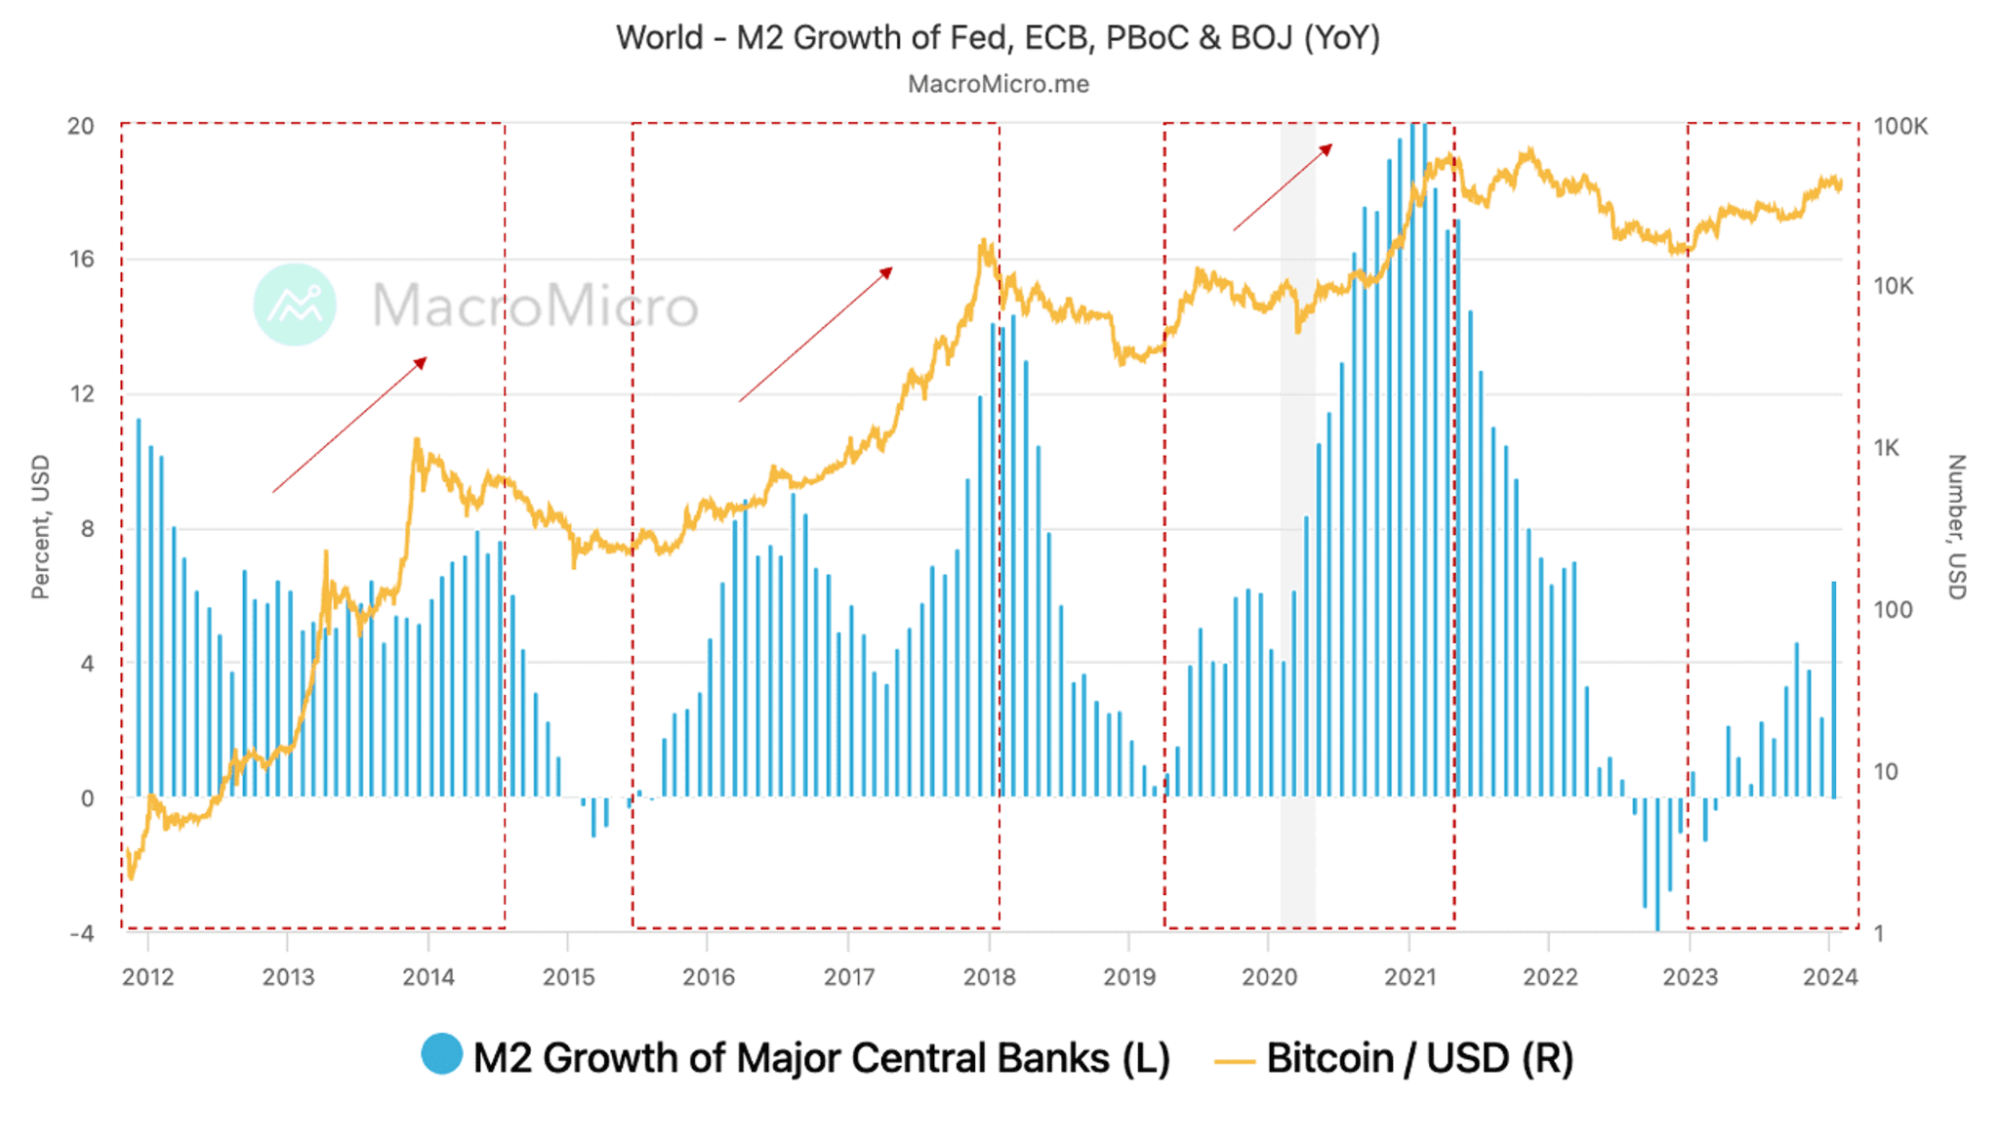
Another analyst on X, @moonshilla, on March 6, 2025, noted that global M2 had just crossed the 100-day exponential moving average (EMA) – a technical indicator that is often a bullish signal.
It shows that two previous similar events—in the spring of 2016 and 2020—were followed by a significant increase in Bitcoin prices. If this pattern repeats itself, March 2025 could be the starting point of a new bull phase.
However, there is an important note. According to Bitcoin Magazine (March 7, 2025), the effect of M2 on Bitcoin is not instantaneous. Research shows that there is a lag of about 56-60 days between liquidity expansion and its impact on BTC prices. This means that if M2 continues to rise in March, the full effect may not be felt until May or June.
Predictions and Warnings
Based on this data, some analysts are optimistic. Lark Davis, in his latest video, predicts that if the M2 trend continues, Bitcoin could reach the peak of the next cycle in late May or early June 2025. He notes Bitcoin’s historical correlation with M2 is 83%, making this indicator one of the most reliable for predicting price movements.
However, there is a note of caution. @SherifDefi on X (February 27, 2025) mentioned that even though M2 is starting to show signs of recovery after a decline since December 2024, investors should remain vigilant. Correlation does not always mean causation. Other factors such as regulation, market sentiment, or geopolitical events can also change direction.
What Does This Mean for Crypto Investors?
M2 is a powerful tool for understanding market dynamics, but it is not a crystal ball. The current increase in global liquidity offers hope for Bitcoin and altcoins, especially with a bull run projected in April or May 2025. However, wise investors will combine it with other analyses—from on-chain data to local monetary policy.
In closing, M2 reminds us that behind crypto volatility, there is a macroeconomic force that cannot be ignored. With growing liquidity, the door to rising prices may be opening—but only time will provide a definitive answer. So, keep an eye on the M2 chart, prepare your strategy, and get ready for what lies ahead