Stay connected with BizTech Community—follow us on Instagram and Facebook for the latest news and reviews delivered straight to you.
The so-called “BTC crash” situation can reflect Bitcoin’s recurring historical dynamics, albeit with complex modern nuances. From December 2024 to February 2025, Bitcoin underwent a significant correction, falling between 20% and 40% from its peak.
The question now is: is this just a pause in the bullish trend, or is it the beginning of a deeper decline? Let’s examine it based on facts, technical data, and other factors.
Bitcoin Correction: A Repeating Historical Pattern
The latest report from Ecoinometrics, dated February 28, 2025, notes that the current decline in Bitcoin’s price has lasted 38 days, with a correction range of 20% -40% from its ATH.
In their tweet on X, they emphasized that historically, a correction like this takes an average of 68 days to recover. “We are only halfway there,” they wrote, hinting that a full recovery might not happen until late April or early May 2025 if they follow the previous pattern.
This view is reinforced by the CEO of CryptoQuant stating that a sharp drop of up to 30% in the bull cycle is common. He recalled the 53% correction in 2021 which was then followed by a surge to a new ATH.
As an analyst, I see a similar pattern: Bitcoin often “clears” euphoria before continuing its upward trend. However, this time there are additional factors complicating the narrative.
Market Pressure: ETFs, Nasdaq, and Macro Uncertainty
Large Outflow from Bitcoin ETFs
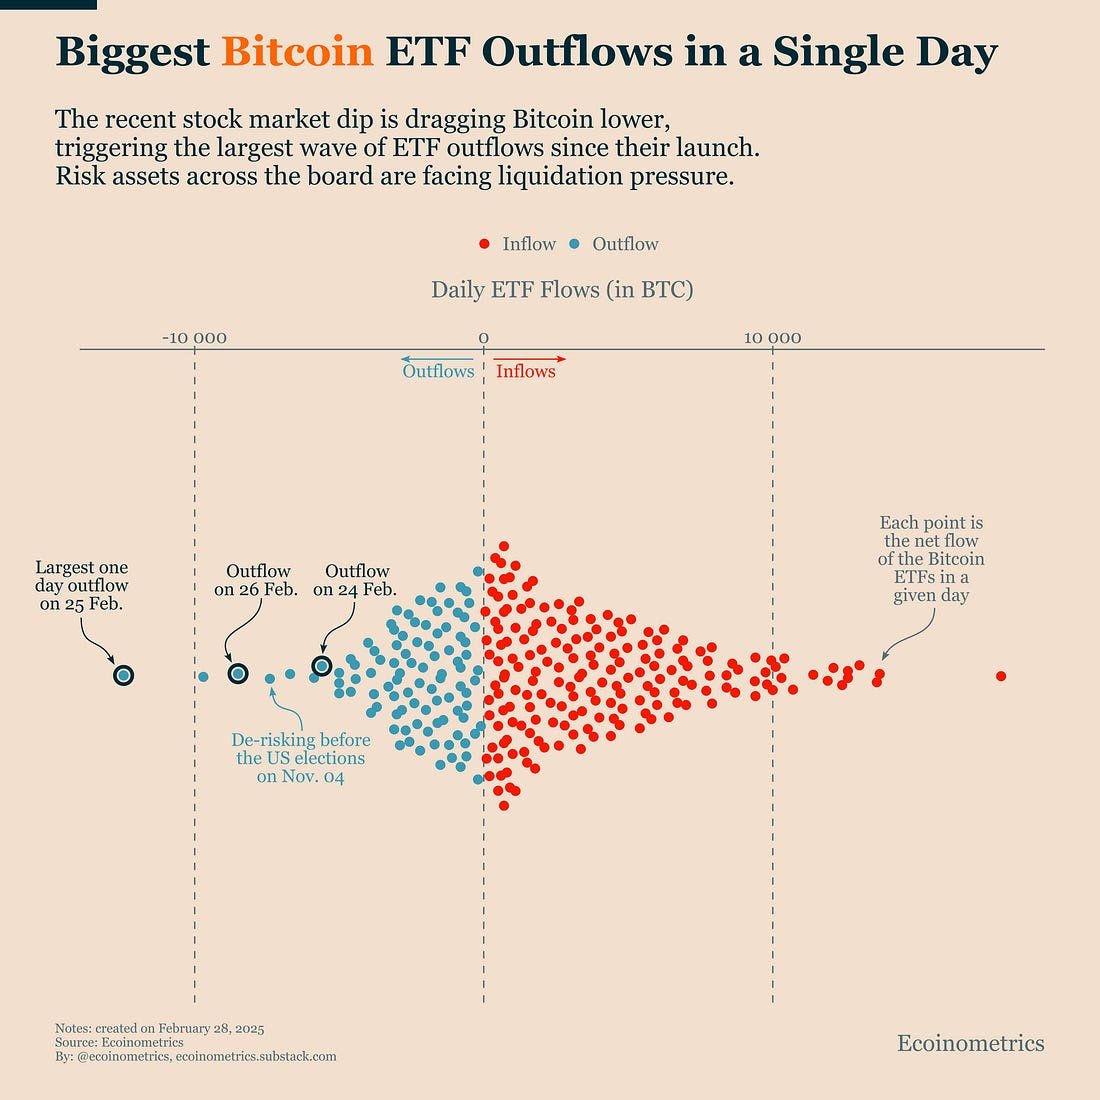
One of the key elements in this situation is the outflow of funds from Bitcoin ETFs. Ecoinometrics reports that this week saw the largest daily outflow since the launch of Bitcoin ETFs. They mentioned that the current correction was exacerbated by “the release of large positions.” Data from the past 30 days shows an unprecedented negative net flow of funds, signaling that institutional investors—who had been the catalyst for Bitcoin’s post-Trump election rise—are now starting to retreat.
At X, @cryptostasher warned that Bitcoin’s failure to break back through $93K monthly could trigger a long consolidation of up to 100-120 days. This indicates that institutional sentiment is shifting, possibly due to broader uncertainty in the financial markets.
High Correlation with Nasdaq
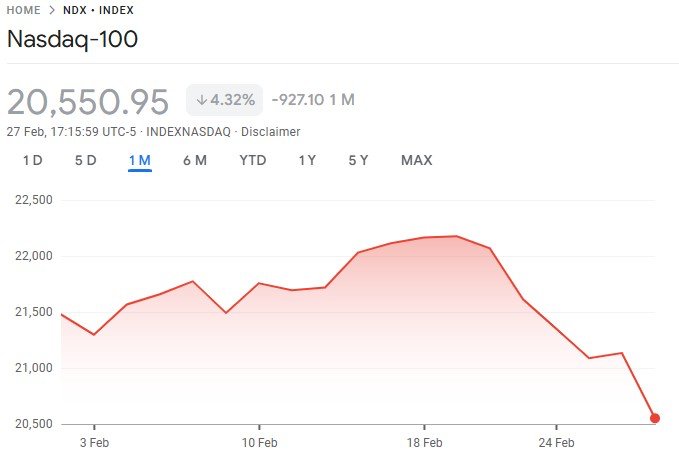
Bitcoin does not move in a vacuum. This correction aligns with the weakening of other risky assets, especially the Nasdaq 100.
Ecoinometrics notes that although Bitcoin usually recovers three times faster than the Nasdaq, as long as the stock index remains depressed, Bitcoin will find it challenging to find upward momentum.
In their tweet, they hypothesized that a “deeper meltdown in the stock market” might be needed to drag Bitcoin to even lower levels. This correlation is a major challenge for BTC amid macroeconomic pressures.
Inflation, Trump, and the Fed
Another external factor is the increase in US inflation expectations to 4.3% next year, as reported by the latest data. This could drive consumption and rising prices, forcing the Federal Reserve to take a more hawkish stance. On the other hand, President Donald Trump’s tariff policy—which has so far caused more anxiety than certainty—has worsened market sentiment. Altcoin Daily’s analysis that this 24% correction was influenced by “broader market dynamics,” including political and economic uncertainty.
Ecoinometrics added in its report that “there is no mechanism that favors Bitcoin or other risky assets in this situation.” This means that recovery could be delayed longer than historical estimates.
Technical Analysis: Support, Resistance, and Projections

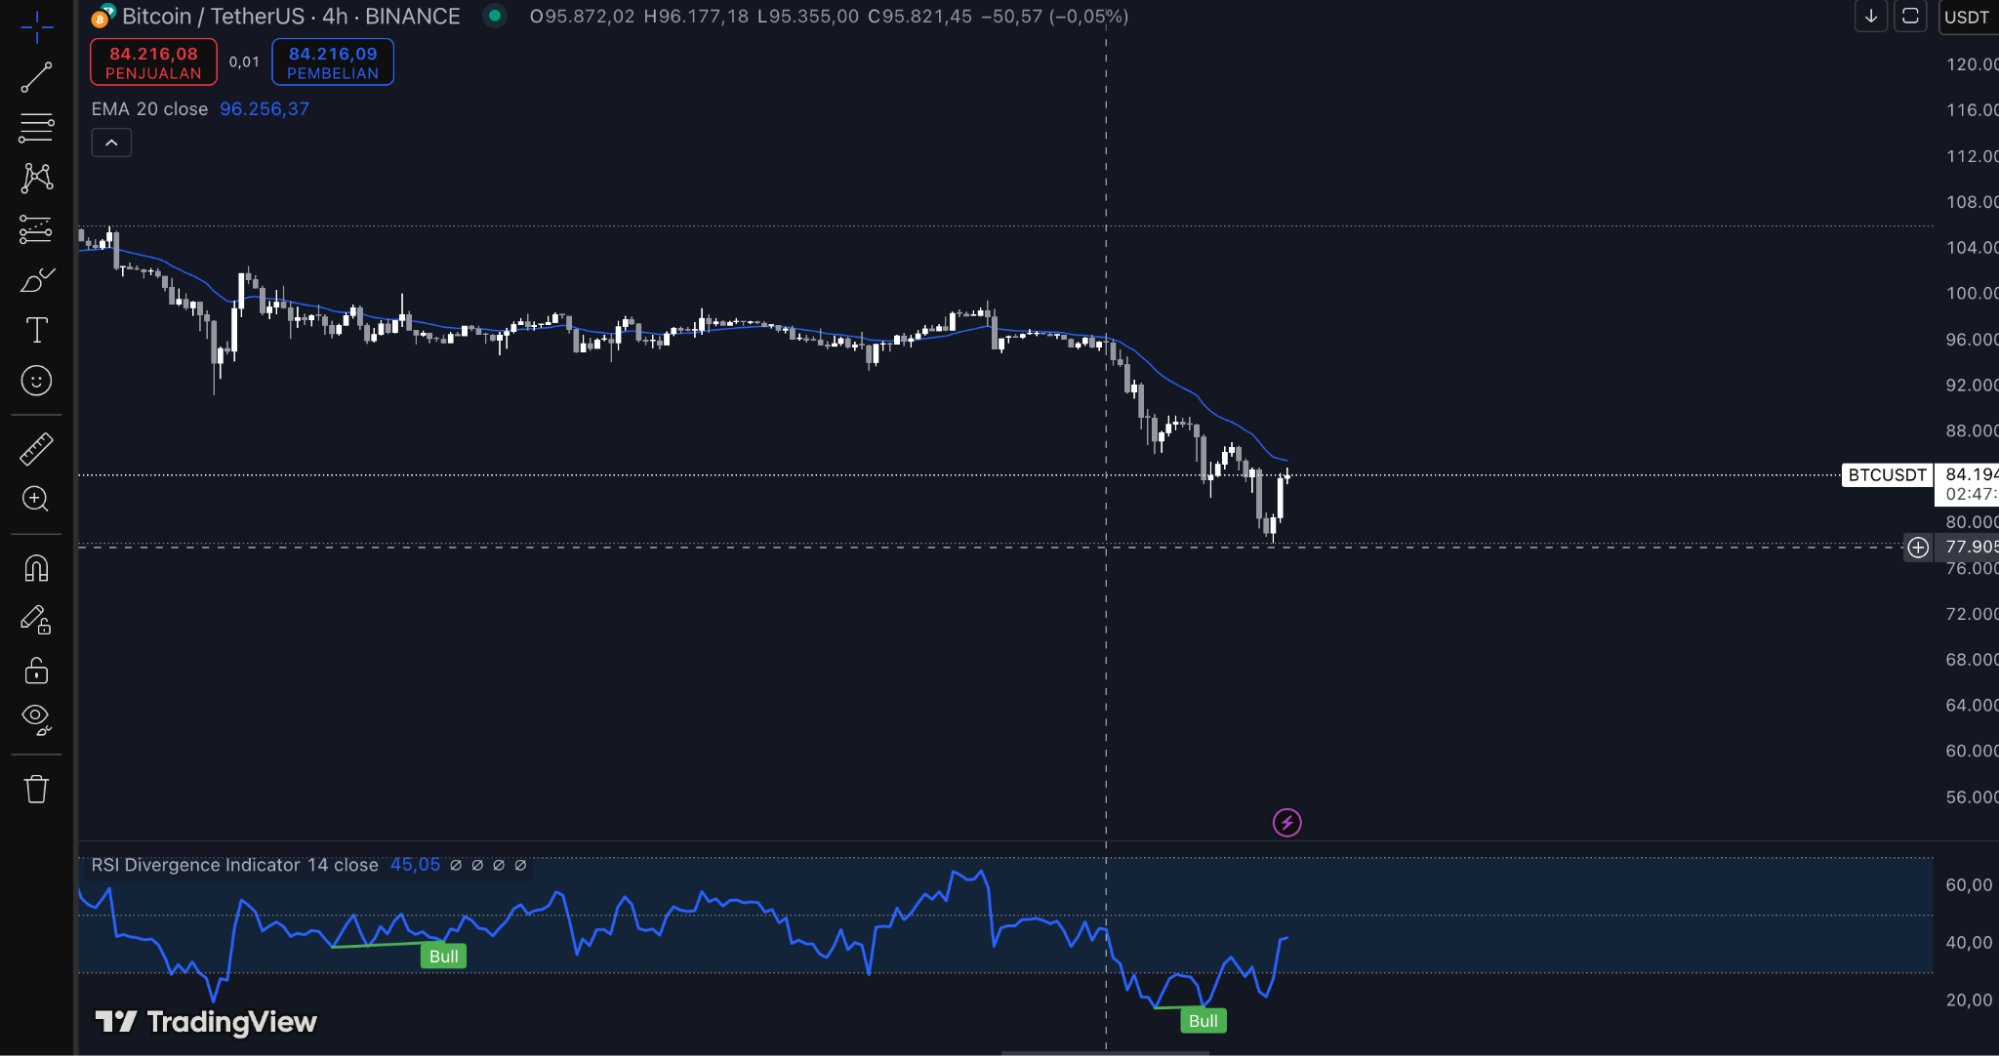
On the technical side, there is a Regular Bullish Divergence on Bitcoin: RSI forms higher lows while prices form Lower Lows. He predicts a potential increase of 20% or more if this divergence is confirmed. Meanwhile, 10x Research, in their report, estimates that if Bitcoin falls from the $90K-$110K range, strong support is at $72K-$74K—a level that could be a point of reversal.
Bitcoin at its current level (around $79K) could rebound to $95K if it holds on to support, forming a V-pattern. However, he also warned of a scenario of a decline back to $79K before the uptrend continues. Ecoinometrics simulations show that the chance of Bitcoin falling below $75K is only 3%, but with the current pressure, this figure is no longer entirely hypothetical.
On the bullish side, @bitfish1—a major miner from China—predicts a recovery in the crypto market between June and October 2025, depending on the US decision on Bitcoin as a strategic reserve asset. If approved, he and CobraVanguard agree that a new ATH above $130K is very likely, supported by the Cup & Handle pattern they observe.
Long-Term Bullish Signals Remain Strong
Although short-term pressure is intense, long-term indicators suggest that Bitcoin’s bullish trend is not over.
The Coinglass analysis that I studied in depth revealed that of the 30 main indicators—like the Bitcoin Ahr999 Index (0.88), Pi Cycle Top (83,900), and Puell Multiple (1.08)—none showed a sell signal. They all pointed to “hold,” indicating that the market had not reached saturation.
The dominance of the Bitcoin market at 59.55% and the supply of 14.37 million BTC in the hands of long-term investors reinforces the narrative that “big hands” still believe in this asset. IntoTheBlock via X noted that short-term traders’ balances have been at their lowest since October 2024—when Bitcoin surged from $60K to a new ATH. “This pattern could be a strong foundation for a rally,” they wrote.
Other indicators, such as the MVRV Ratio and RHODL Ratio, also show room for increase. Even with the institutional attention reflected in the ETF to BTC ratio (5.42%) and MicroStrategy’s Average Bitcoin Cost at $63,657 (far from the historical peak of $155,655), there is no sign that the market is at the top of the cycle.
Predictions and Recommendations
The available data shows that this “BTC crash” is a natural correction in a larger bull cycle. Based on historical patterns, a full recovery may take another 30-60 days until the end of April 2025, although pressure from ETFs, the Nasdaq, and macroeconomics could extend it to June-October 2025.
The $72K-$74K level is critical support that investors should watch out for. If it holds, it could be the basis for a rebound to $95K or even $130K in an optimistic scenario. However, if $75K breaks down, selling pressure could increase. The short-term signal remains volatile, but the long-term is bullish.


